הנה דברים שמשקיעים צריכים לחשוב עליהם בקשר לחוויית העובד.
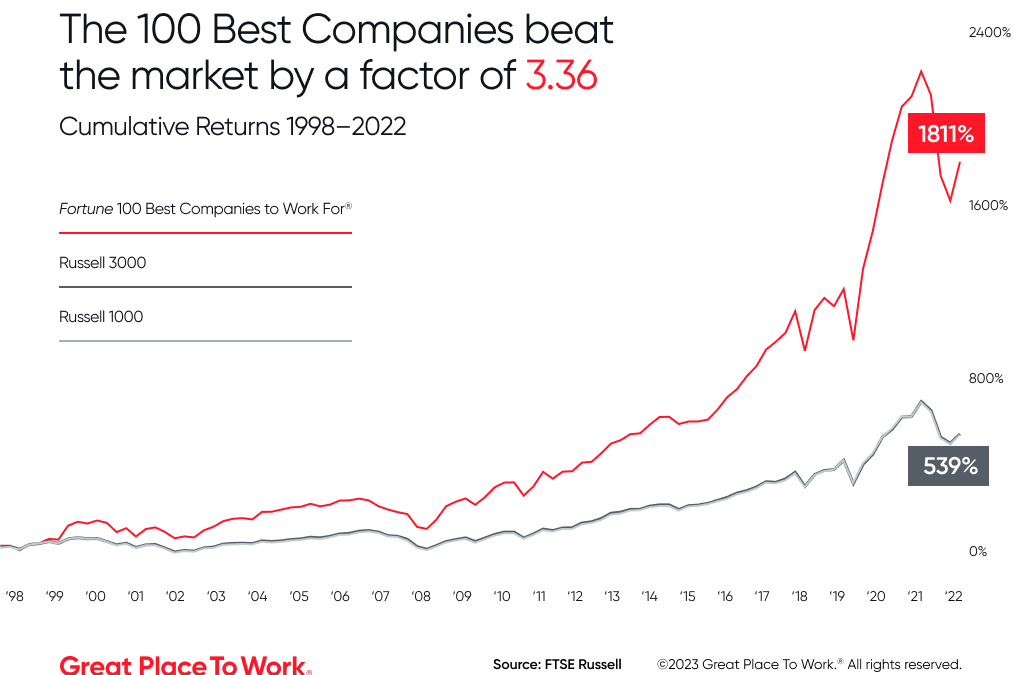
הביצועים של חברות שמופיעות ברשימת Fortune 100 Best Companies to Work For® עולים באופן עקבי על ביצועי השוק בשיעור של פי 3.36, לפי FTSE Russell, ספק המדדים והנתונים העולמי.
חברת FTSE Russell בחנה נתוני שוק מ-25 שנים ופיתחה מדד היפותטי באמצעות החברות שמגיעות לרשימה השנתית של 100 החברות הטובות ביותר המורכבת על ידי Great Place To Work®. חברת FTSE Russell מנתחת את התשואות השנתיות של החברות הנסחרות בבורסה שמופיעות ברשימה ומשווה תוצאות אלה לבוחני ביצועים אחרים.
התוצאה? אם הייתם משקיעים ב-100 החברות הטובות ביותר, הייתם משלשים את מה שהשקעה דומה הייתה מניבה בתיק השקעות אחר, ואף יותר מזה.
אף שבחינת נתונים בדיעבד אינה הבטחה להצלחת השוק בעתיד, המחקר מציע הסבר משכנע להתחשבות בחוויית העובד באסטרטגיית השקעות.
"מדידה מעניקה תובנות", אומרת קת'רין יושימוטו (Catherine Yoshimoto), דירקטורית ניהול מוצרים בחברת FTSE Russel. "היא נותנת לכם מידע שלא היה לכם לפני כן."
החשיבות של תרבות
באילו מדדים משקיעים יכולים להשתמש כדי להבין אם בחברה יש עובדים משגשגים ותרבות עם אמון גבוה?
לחברות שמגיעות באופן קבוע לרשימת 100 הטובות ביותר יש כמה מאפיינים משותפים שמהווים קווים מנחים מועילים. הנה כמה מהמדדים שמבדילים את החברות הטובות ביותר, לפי הניתוח של Great Place To Work:
1. שימור עובדים
בקרב חברות ברשימת 100 החברות הטובות ביותר התחלופה קטנה בחצי, לעומת המקבילות להן בתעשייה.
גם כשהן מתמודדות עם פיטורים, חברות צריכות להשאיר את העובדים הטובים ביותר. כשעובדים עוזבים את החברה, הם לוקחים איתם מערכות יחסים, ידע מוסדי ותרומות עתידיות. זאת הסיבה ששימור עובדים מהווה אינדיקציה חשובה לביצועים של חברה בעתיד.
2. הבריאות הפסיכולוגית והרגשית של העובדים
ברשימת 100 החברות הטובות ביותר, 83% מהעובדים מדווחים על מקום עבודה בריא, בהשוואה ל-52% בלבד בחברות אמריקאיות טיפוסיות.
כשאין לכם סביבת עבודה בריאה, החדשנות והפרודוקטיביות נפגעות. בטיחות פסיכולוגית, או התחושות של עובדים בקשר ללקיחת סיכונים במקום העבודה, היא אלמנט בסיסי בתרבות של חדשנות.
למשקיעים כדאי להתחשב באופן שבו חברה יוצרת תרבות שבה עובדים יכולים ליצור רעיונות חדשים, לפתח מיומנויות חדשות ולדחוף את עצמם לרמות חדשות של ביצועים. כששאלו חברות מ-100 החברות הטובות ביותר איך הן השקיעו בבריאות העובדים, הן הציעו יוזמות בכמה אזורי מיקוד:
- הצעת גמישות מרבית
- הבטחה לעובדים של שימוש בחופשה בתשלום
- השקעה במשאבים של בריאות נפשית
פחות ממחצית מהעובדים בארה"ב מנצלים את כל החופשות שלהם בתשלום, לפי מחקרה שנערך לאחרונה על ידי מכון Pew. הוא מצביע על אפשרות ליתרון תחרותי למשקיעים שמזהים חברות שנותנות לעובדים שלהם לשגשג מעבר לשעות העבודה.
3. השקעת מאמצים לפי שיקול דעת
לביצועים יש חשיבות, והחברות הנהדרות ברשימת 100 החברות הטובות אינן יוצאות דופן. הכנסה לעובד – מדד חשוב שרבים מהמשקיעים בוחנים היטב – הוכפל בחברות ברשימת 100 החברות הטובות ביותר.
אבל חשוב גם איך אתם מגיעים לזינוק הזה בביצועים.
חברות אלה מצאו דרכים לקבל יותר מהעובדים שלהן באמצעות השקעה בצמיחה והתפתחות שלהם – ולאחר מכן קטפו את הפירות. שמונה ושמונה אחוזים מהעובדים ברשימות 100 החברות הטובות ביותר השקיעו מאמץ נוסף בעבודה שלהם. רק 52% מהעובדים אומרים את אותו הדבר במקום עבודה טיפוסי.
כשמבצעים הערכה בריאותית-פיננסית של חברה, חייבים לקבל את נקודת המבט של העובדים.
האם עובדים באמת מושקעים במשימת החברה ומנצלים את כל הכישורים הייחודיים שלהם בשם הארגון שלהם? או האם נתוני הפרודוקטיביות האלה רק מבלבלים ומסווים תרבות שאינה בריאה כלל – שבה עובדים מעגלים פינות, מתעסקים עם נתונים ולא מדווחים על שגיאות כי הם פוחדים מתגובה?
אם תקשיבו לעובדים תקבלו נתונים שונים על הבריאות והביצועים של חברה. האם להשתמש בנתונים אלה כהנחיה באסטרטגיית ההשקעות שלכם? זה תלוי רק בכם.
הביצועים של החברה שלכם
התחילו עם Certification™ כדי לראות איך העובדים שלכם תורמים לשורת הרווח.
הערה: התשואות המופיעות הן היפותטיות ולמטרות ניתוח בלבד. ביצועים מהעבר אינם הבטחה לתוצאות בעתיד. הטבלאות והגרפים מופיעים למטרות הדגמה בלבד. תשואות המדדים המוצגות אינן מייצגות בהכרח את התוצאות של מסחר בפועל של נכסים להשקעה. תשואות מסוימות המוצגות עשויות לשקף ביצועים בעבר. הביצועים

יונתן פייטרה
יונתן פייטרה, מייסד Great Place To Work® Israel התחיל את דרכו בעולם השיווק ומילא תפקידים ניהוליים בכירים בחברות גלובליות מובילות כמו קוקה-קולה, נסטלה ויוניליוור. במהלך הקריירה שלו נחשף לתרבויות עבודה מגוונות ומעשירות.
בתקופת הקורונה, כאשר ראה את השינויים המשמעותיים בעולם העבודה, הבין יונתן את הצורך בקידום תרבות ארגונית שתסייע לאנשים לממש את הפוטנציאל שלהם ותעזור לארגונים למקסם את ההון האנושי שלהם. מטרתו היא ליצור סביבת עבודה שמיטיבה עם האנשים והעסקים כאחד. בעקבות תובנה זו, הוא החליט להקים את השלוחה הישראלית של חברת ®Great Place To Work.
יונתן הוא בוגר אוניברסיטת תל אביב, בעל תואר ראשון בסוציולוגיה ואנתרופולוגיה ותואר שני במנהל עסקים בהתמחות ביזמות, חדשנות וניהול טכנולוגי. הוא מרצה על מנהיגות וניהול, עם דגש על הקשר בין תרבות ארגונית להצלחה עסקית.


